Mapping Solar Particle Events in Low Earth Orbit
by Tobiáš Kuchař, AdvaSpace
The task
A single compact pixel detector was used to address a question normally reserved for dedicated space-weather missions: where, when and to which particle species do solar particle events (SPEs) deliver their dose in low Earth orbit? The deliverable was not a table of storm onsets but a video, acontinuously interpolated, species-resolved map of the radiation field covering the whole measurement campaign, in which each event can be watched as it develops.
Instrument and mission
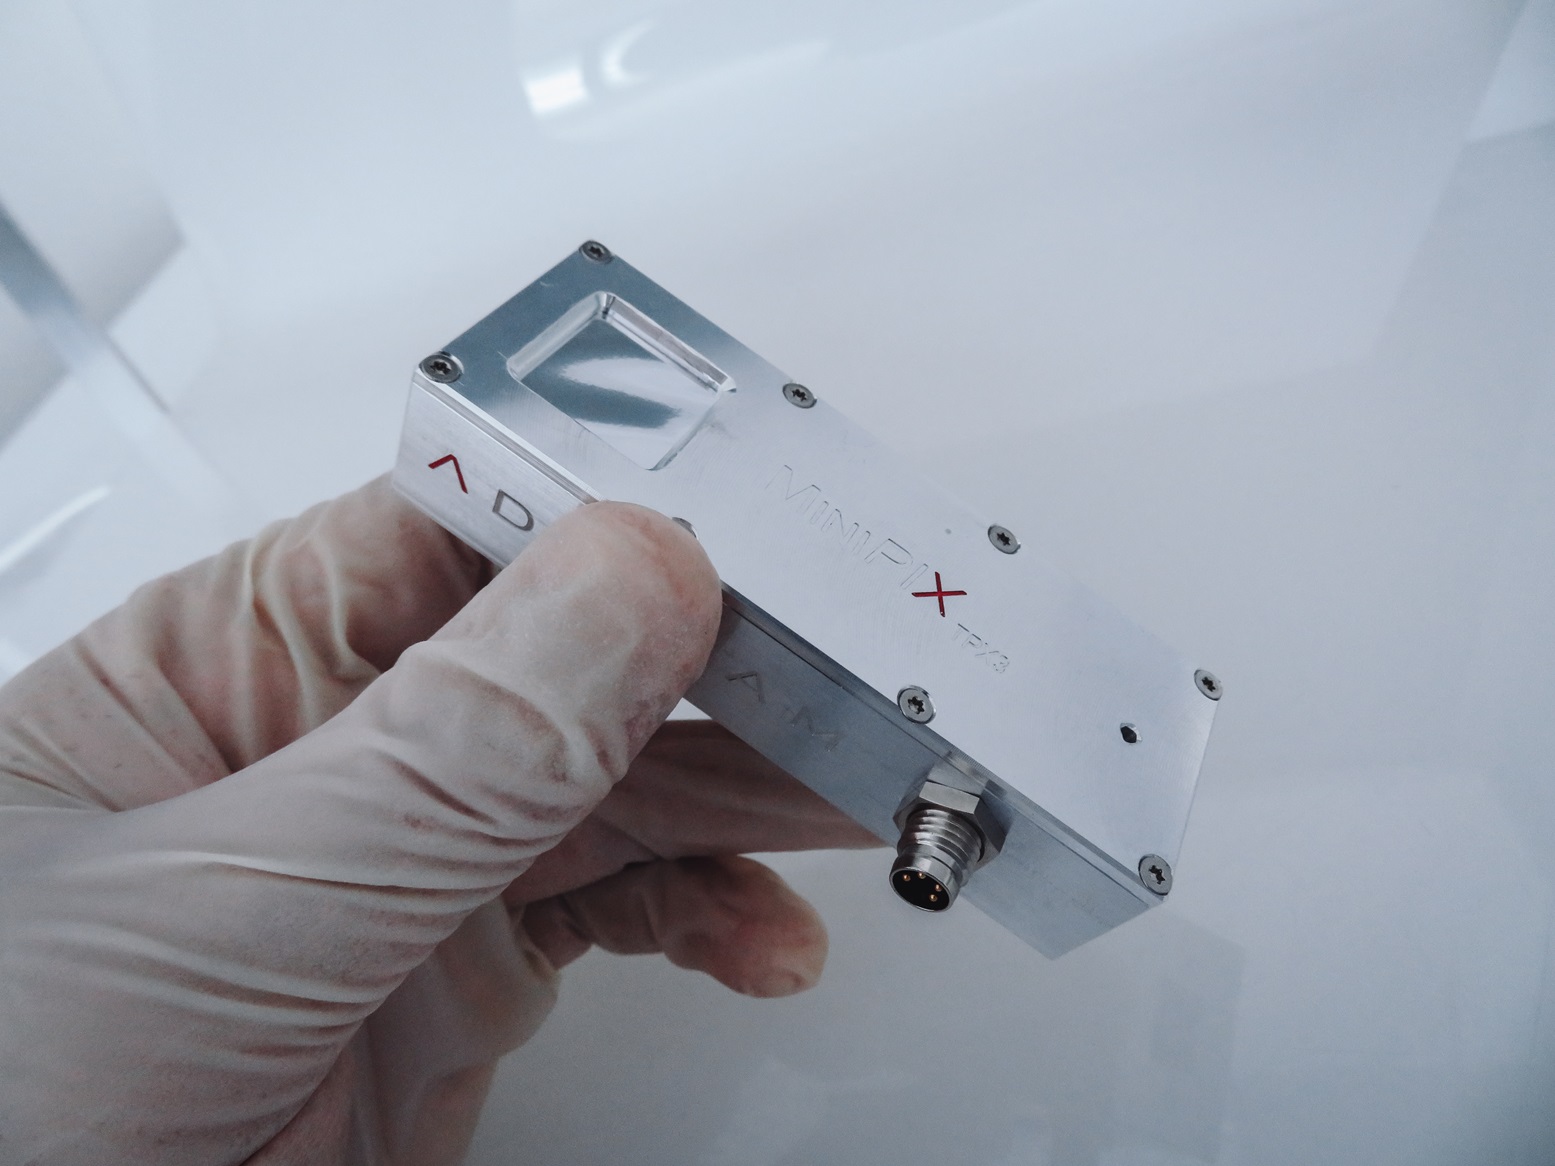
The data come from a MiniPIX SPACE unit (Timepix3 ASIC, 500 µm silicon sensor, 55 µm pitch, 200 V bias, 5 keV threshold, behind a 5 mm aluminium shield) flown on OneWeb's JoeySat technology demonstrator (NORAD 56725, inclination 86.68°) and operated in frame mode. Two orbital phases were analysed: 613 km from January to October 2024, and 1175 km from February 2025 after the satellite raised its orbit. Each event is stored as a cluster carrying its deposited energy, its morphology and the timestamp of the frame in which it was recorded. The TraX engine classifies every cluster into protons,electrons and heavy ions. Clusters of one to four pixels are too small to be a proton or heavy-ion track and are therefore labelled electrons by default. At that size the deposition says little about its origin, and the class is expected to mix low-energy electrons with photon interactions, so it is kept apart from the electrons that leave a resolved track. The species discrimination reported here therefore comes from track morphology in a single sensor layer, without a telescope stack or coincidence electronics.
Why raw flux is not enough
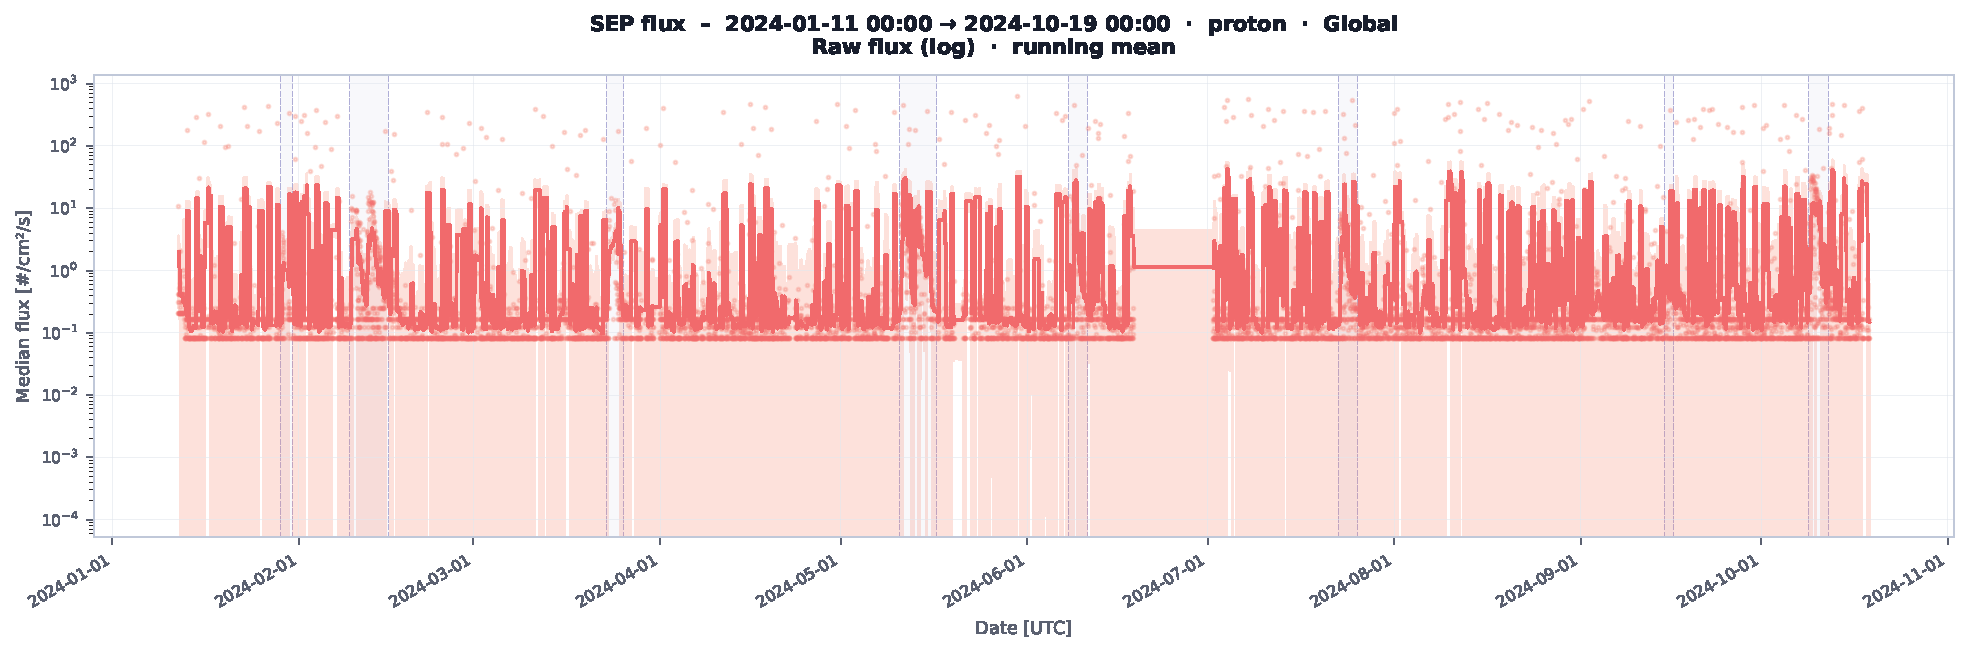
Plotted globally, the raw count rate is governed by geography. Every pass through the South Atlantic Anomaly (SAA) produces an excursion larger than any storm signal, so the unnormalised time series oscillates with the orbital period and an SPE is essentially invisible in it. Each quantity is therefore referenced to its own local baseline.
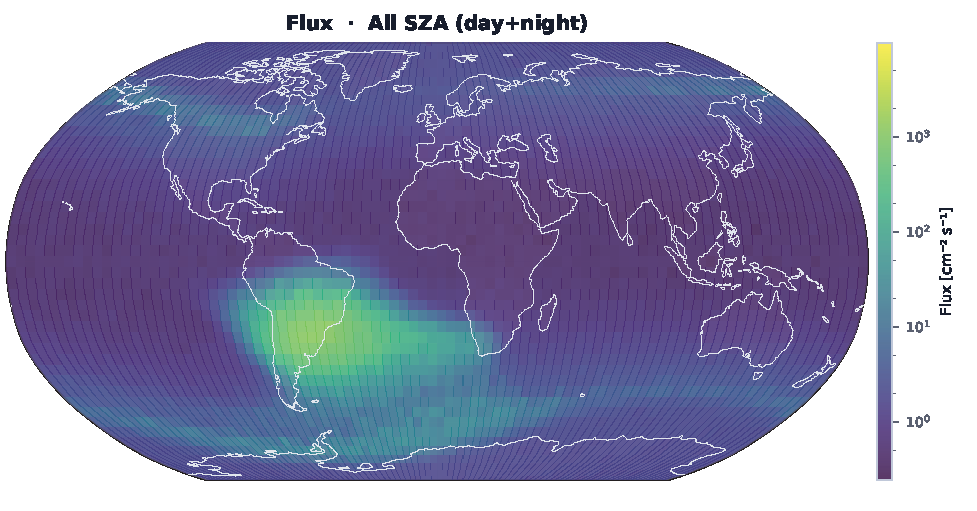
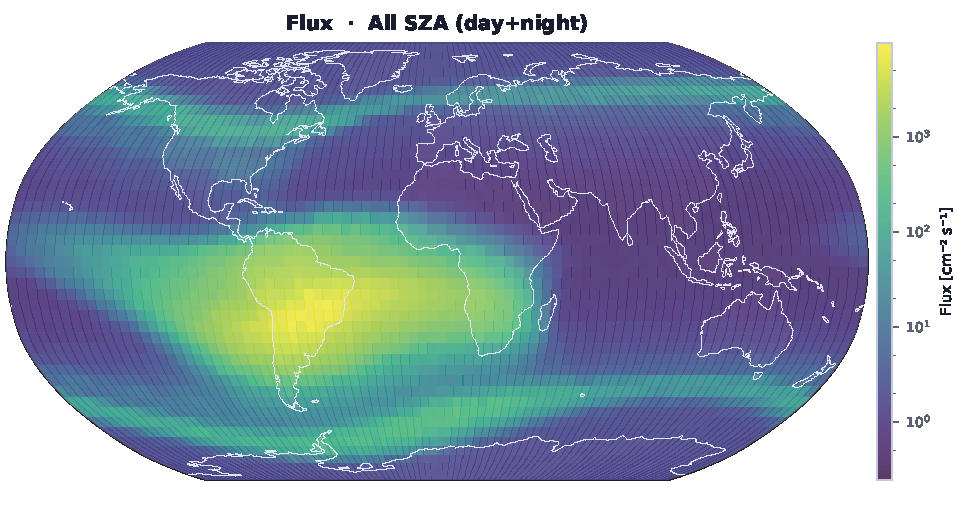
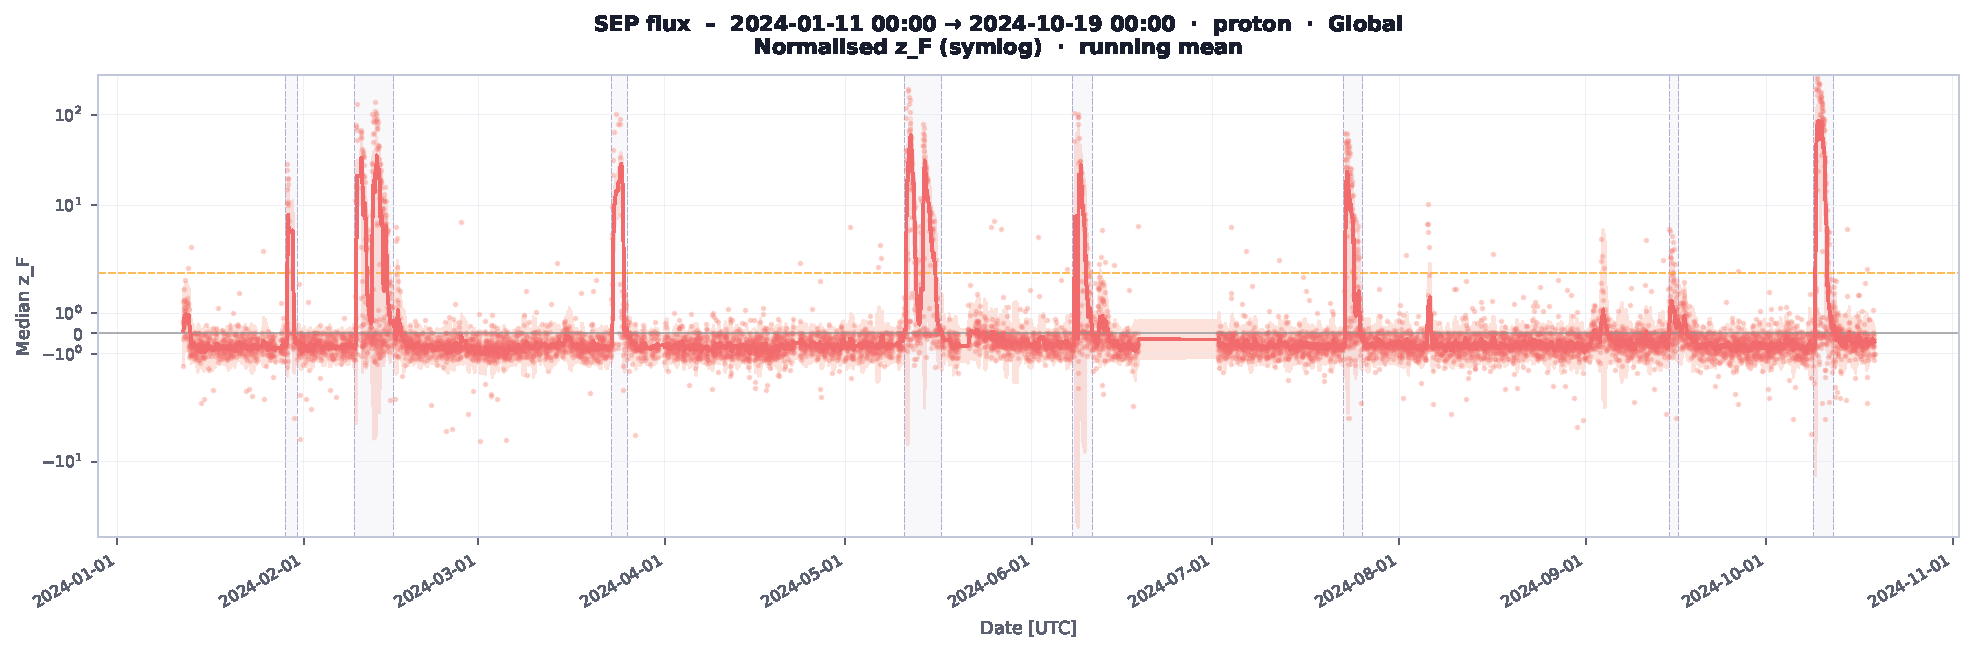
Quiet-time flux baselines were built for each particle class in 2°geographic bins, separately for the two orbital phases (Fig. 1). The two are not interchangeable: at 1175 km the spacecraft sits deeper in the inner belt, the SAA is both brighter and wider, and the trapped population extends tomid-latitudes that are almost empty at 613 km. Each altitude was therefore normalised against its own baseline. Each bin is then expressed as a robust, MAD-based z-score, that is, the number of quiet-time standard deviations by which the current value departs from its own local norm. Figure 2 contrasts the two representations of the same data: in the raw series the storms are buried under the orbital modulation, whereas in the normalised series they emerge as isolated excursions well above the detection threshold.
Identifying the storms
The quiet periods that define the baselines are the intervals during which no SPE is in progress, and they have to be found before the baselines canbe finalised. This was done in two passes. A provisional baseline computed over the entire campaign was used to form the proton flux z-score over the polar caps (|latitude| = 60 to 90°), where the geomagnetic cutoff rigidity is lowest and solar energetic particles reach the spacecraft least attenuated. An interval was flagged as an SPE when that z-score exceeded 3 for at least 6 h continuously. Eight events were isolated in the 613 km dataset, among themthe G5 storm of 10 May 2024, the strongest since 2003, and seven in the 1175 km dataset, consistent with that period falling later in the solar cycle. The flagged intervals, marked in Fig. 2, were then removed and the baselines recomputed, so that the reference field contains only undisturbed data.
Building the video
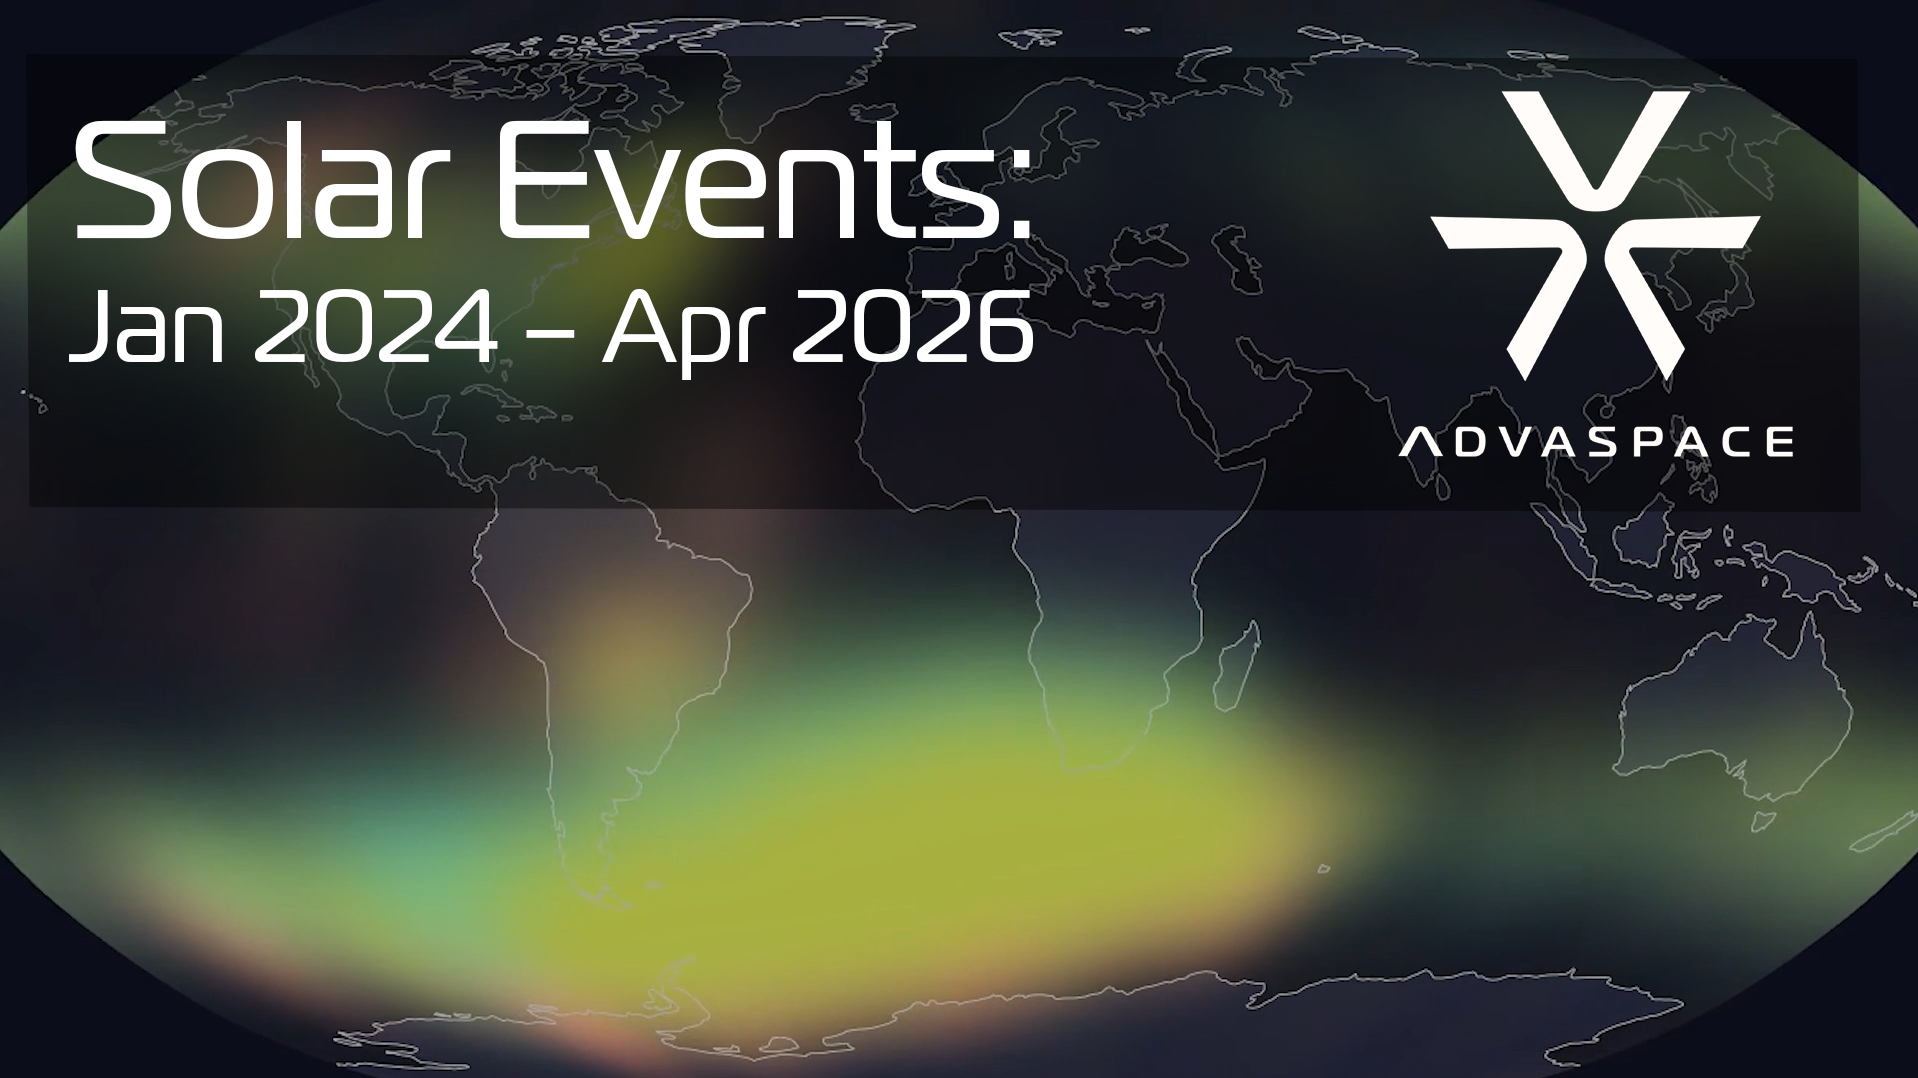
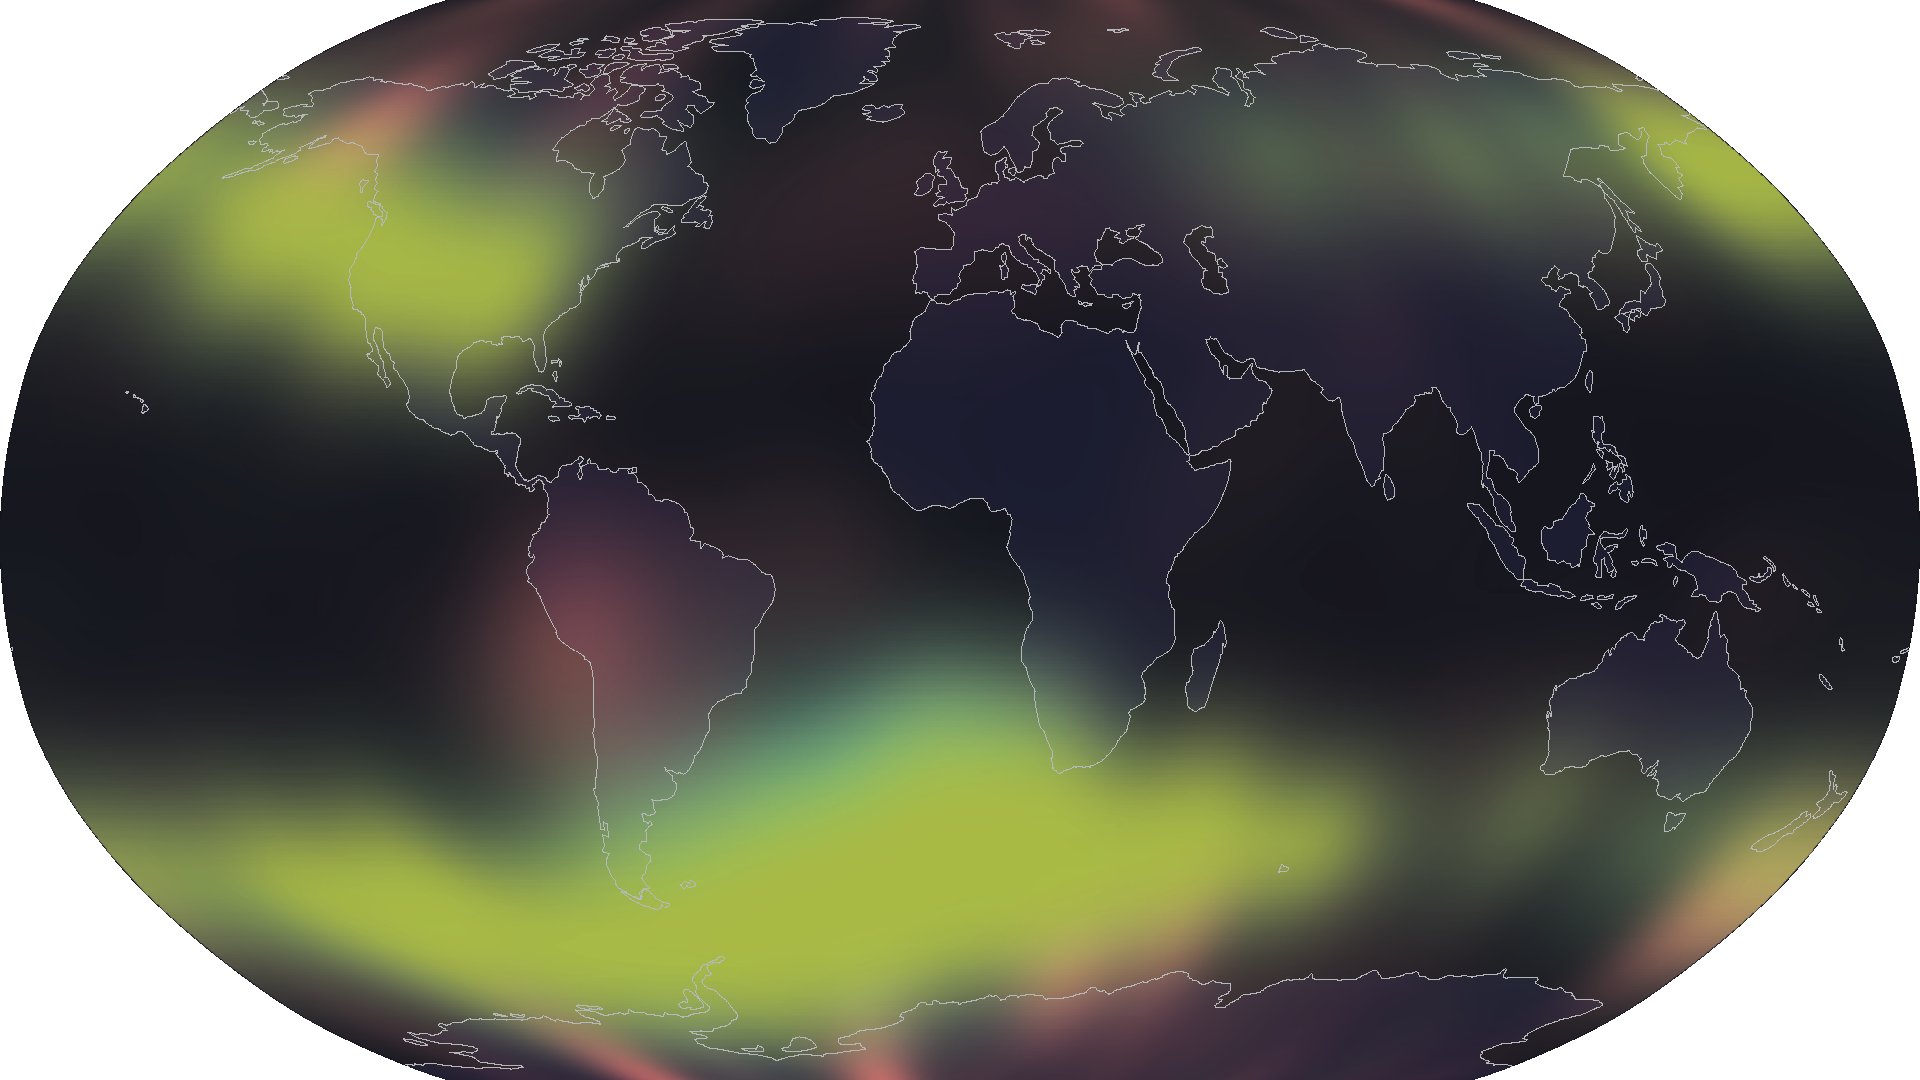
One video was produced per orbital phase. Each frame aggregates a 5 d window. The 2° bins are replaced by Gaussian kernels to give a continuous spatial field rather than a pixelated histogram, and consecutive frames are interpolated in time, so the result plays as a smooth evolution instead of a slideshow. The three particle classes are rendered in independent colour channels, protons in red, electrons in blue and small clusters in green, which makes species-specific behaviour directly readable: a storm that fills the polar caps with protons looks nothing like one that loads the outer electron belt. Figure 3 shows a single frame at the onset of the May 2024 storm.
One statistical safeguard was required. Near the geomagnetic equator the proton statistics per bin are low, and a handful of counts can produce a spuriously large z-score. A shrinkage step weights each bin by its statistical strength, pulling sparsely populated bins back towards zero so that only well-sampled excursions survive into the frame.
What this demonstrates
A single palm-sized pixel detector, correctly calibrated and paired witha rigorous normalisation chain, yields a species-resolved, quantitative picture of the low Earth orbit radiation environment and of its response to solar activity, from one sensor on one spacecraft. For satellite operators this offers dose and single-event-effect context measured on their own hardware, andfor space-weather users an additional independent set of eyes in orbit.
Applications